
Commerce dashboard shows economic impact of COVID-19
Published 3:30 pm Friday, September 25, 2020
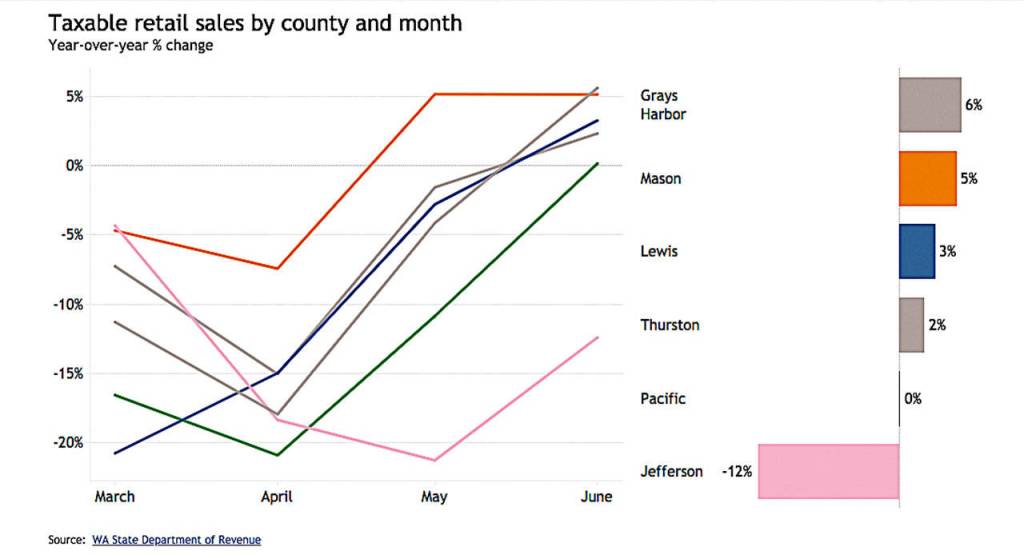


Taxable retail sales in Grays Harbor County were up in the month of August, about $6 million ahead of sales in August 2019, according to the state Department of Commerce’s Economic Recovery Dashboard, an online tool unveiled Monday to help people track effects of the pandemic.
The dashboard analyzes data on the state’s economy and offers breakdowns by county about the economy, employment rate and support program participation.
“The economic impact of COVID-19 on individuals, families and businesses is like nothing we’ve ever seen before,” said Washington State Commerce Director Lisa Brown. “The depth and complexity of the challenge we’re dealing with demands that we use data in new ways to help every family, every community and every industry get back on their feet, stronger and more resilient than before.”
The dashboard details, on regional, demographic and industry sector levels, numerous metrics that could help guide state and local leaders as they chart a path to an equitable, statewide economic recovery, according to Commerce.
The dashboard is available to the public on the Commerce website, https://www.commerce.wa.gov/datadashboard/.
Grays Harbor County data
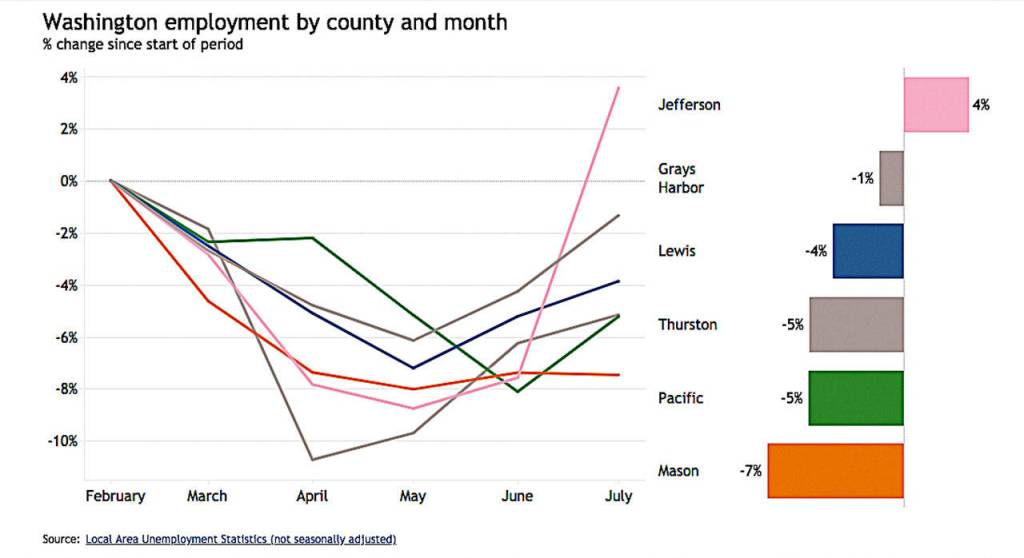
Monday the dashboard shows Grays Harbor County total employment — the number of non-farm workers in the county — at 27,000 trending back up to pre-COVID numbers after dipping to 26,000 in May. The unemployment rate in August was 11.2%, among the highest in the state but trending down. The rate was 6.8% in March, then skyrocketed as pandemic shutdowns grew the rate to a peak of 19.3% in April. The rate improved to 12.2% in June, rose to 13.6% in July, then dropped slightly to its current level.
Taxable retail sales, however, were up in August in Grays Harbor County. August 2020 saw retail sales of $118 million, an increase of $6 million over August of last year. Retail sales dropped to $77 million in April, early in COVID shutdowns, compared to $93 million in April 2019. Taxable retail sales have grown since April by about $20 million a month.
Participation in social support programs is up in the county, according to the dashboard. In July, the county had 16,651 in the food stamp program that issues EBT cards, up 10% since May 2019. According to Commerce, there were 14,653 participants in February, growing rapidly between March and July. As of July, the county had 1,272 TANF (temporary assistance for needy families) participants, up 33% from May 2019. The number peaked in June at 1,301.
Consumer behavior has fluctuated significantly since the pandemic began. Compared to the level of credit card spending in January, spending declined by nearly 50% between March 8 and April 5, then rose by more than 50% between April 5 and May 17. Mid-July and mid-August saw sharp increases in credit card spending, up 20% over January 2020 spending. As of Sept. 13, credit card spending stood at 7% above the January level.
Statewide data
Two months after reopening efforts began, Washington’s employment decline is still 30% greater than the lowest point in the Great Recession a decade ago, according to the dashboard. Unemployment trends in Washington state are tracking similarly with most other states with a steep drop through April and slow but steady growth since May.
While construction has recovered 80% of lost jobs as of June, leisure and hospitality has only recovered about one-third of job losses and is the hardest hit of all industries.
There are early signs of disproportionate unemployment impacts across race groups, particularly Pacific Islanders and black workers, according to the dashboard.
An additional 100,000 people have signed up for food or temporary cash assistance since February, with larger increases in the central Washington, Spokane and Tri-Cities areas.
The Economic Recovery dashboard was developed with federal CARES Act funding to provide actionable data analysis and improve understanding of where and how the COVID-19 pandemic is impacting Washington state. The dashboard will evolve as Commerce updates the available views and data sources where possible. Data is currently updated on a monthly basis.